There are a number of structures the monitoring data is available in. While some systems provide data on a regular basis, the others just provide it rarely, only when an event occurs. Depending on the type of data, its importance also varies. Some data are crucial for identifying the issues and the same type, the other data is important for resolving it. However, no matter what the type is, it is only the monitoring data which lets you observe the inner working of the system.
As all the data is not useful, you need to collect it and classify it so that the meaningful data can be retrieved and used for locating and fixing the performance issues. You need to remember that though collecting data is not costly, it becomes just priceless when you need it but don’t actually have it. In this write-up, you will get to know about the types of monitoring data you need to collect and the ways to classify it.
Metrics
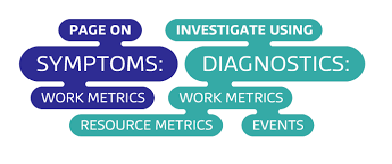
Metrics are collected at regular intervals because they capture a particular value related to your system, at a particular time. It depends on the values being captured that whether the metrics will be collected every second, every minute or at any other regular interval. Basically, the metrics are classified into two main types- Resource Metrics and Work Metrics. What you need to do is analyze your software infrastructure, inspect that which metrics are available and then, collect them.
1. Work Metrics
These refer to the useful output of your system which indicates its performance and top-level health. You can divide these metrics into four types which are:
- Throughput
Generally, recorded as an absolute number, throughput is the amount of work your system does in the particular time unit. Better it is if the throughput is high.
- Success
The proportion of work that is executed successfully, without any issue comes under the success metrics.
- Error
It is the count of the results which came with an error. Generally, it is measured as the rate of errors in a particular time unit. It can also be expressed as throughput to yield errors in a particular work unit. In the case there are many potential errors, the error metrics are captured separately from other metrics. However, not all the errors are equally serious; some are more actionable than others.
- Performance
These metrics are the measurement of the efficiency of a particular component as they are a record that how efficiently a particular component is doing its job. Latency is the most common performance metric; it is the measure of the time a particular unit requires to perform a particular task.
It is clear that all these metrics are crucial to know about the efficiency and the performance of the system that whether it is doing the job it is designed for and if it is delivering the quality work.
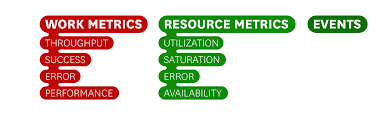
2. Resource Metrics
Many components of your software infrastructure act as a resource for other systems, though it depends whether they are the low-level components or the high-level. In general, the resource metrics can help you with the diagnosis and investigation of the problems. While collecting resource metrics, you need to cover the following areas:
- Utilization
It represents the percentage of time the particular resource was in use.
- Saturation
It is the amount of work that is queued i.e. it has been requested from the particular resource but is not yet serviced.
- Errors
These are the errors which are not shown in the work a particular resource produces.
- Availability
It is only for those resources which can be regularly checked for availability. It is the percentage of time a particular resource reacted to the work requests.
3. Other Metrics
These are the metrics which neither comes in the work metrics nor in the resource metrics, like database lock or the count of cache hits. These need to be captured when you have any doubt or want to make the complex system more observable.
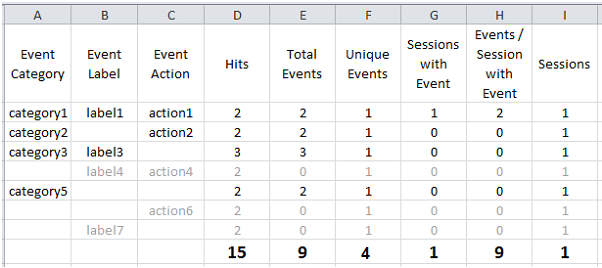
Events
These are the infrequent occurrences that can provide you important information about the changes in your system’s behavior. Examples of events include:
- Alerts
- Changes
- Scaling events
Events provide the information that can be interpreted and is meaningful on its own. Though most often they are used for investigating issues and correlating across systems, they can also be used for generating alerts.
Characteristics of Good Monitoring Data
Whether it is the metrics or the events, you should always capture the good data. The characteristics of good data include:
- Easy to understand
- Granular i.e. collected at a frequency
- Tagged by multiple scopes
- Long-lived
Conclusion
So, collect as many metrics and events you can but make sure to collect that with sufficient granularity. Also, in order to maximize the value of your data, you can tag events and metrics with different scopes and finally, retain them for at least 15 months.